The Carve Scoring System (CSS): Beyond Vanity Metrics

By Scott Goldberg
Refreshed January 27, 2026
TLDR: How to Measure Media Coverage
While UVPMs are a standard metric across outlets, it’s disconnected from a piece of coverage’s impact on core business outcomes.
Proper PR measurement starts with understanding how PR is different from other channels.
Our Carve Scoring System (CSS) evaluates eight criteria: Influence, Content, Image or Video, Type, Tone, Executive Visibility, Paywall, and Links.
The CSS helps understand which coverage can move the business forward, versus just looks good in a report.
Seven years ago, we introduced the Carve Scoring System (CSS) to quantify the value of the media coverage we secure for our client partners.
A client challenged us on how to measure media coverage and the use of "vanity metrics" in PR — inflated figures like "billions of impressions" — that often mask the actual impact of the work. We completely agreed.
These numbers look impressive and are still useful in some ways. They’re a directional measure of an outlet’s scale that essentially tells us how big the room we’re speaking in is. They’re also often the only standardized metric across outlets. UVPMs are flawed, but at least they’re applied consistently.
The issue is that they are largely disconnected from core business outcomes. What does a publication's scale tell us about the quality of the coverage? What if the story had a negative bent? That huge UVPM now takes a darker turn.
These metrics can describe scale, but they can’t explain impact. And that gap matters, because PR plays a fundamentally different role in how companies build long-term advantage.
Why PR is Different?
Sometimes people attempt to judge PR using the logic of performance marketing because those metrics are familiar and comforting. But that framework breaks down quickly.
Paid channels are transactional by design. You control the message, the placement, the timing, and the audience, and you can often expect an immediate, proportional return on investment. If you need quick wins, by all means, budget for ads.
PR operates under a different set of constraints. While you can’t control the outcome, those outcomes over time shape your reputation, build authority, earn trust, and position you as an industry leader. This is the core PR measurement challenge. The effects are cumulative, uneven, and often indirect.
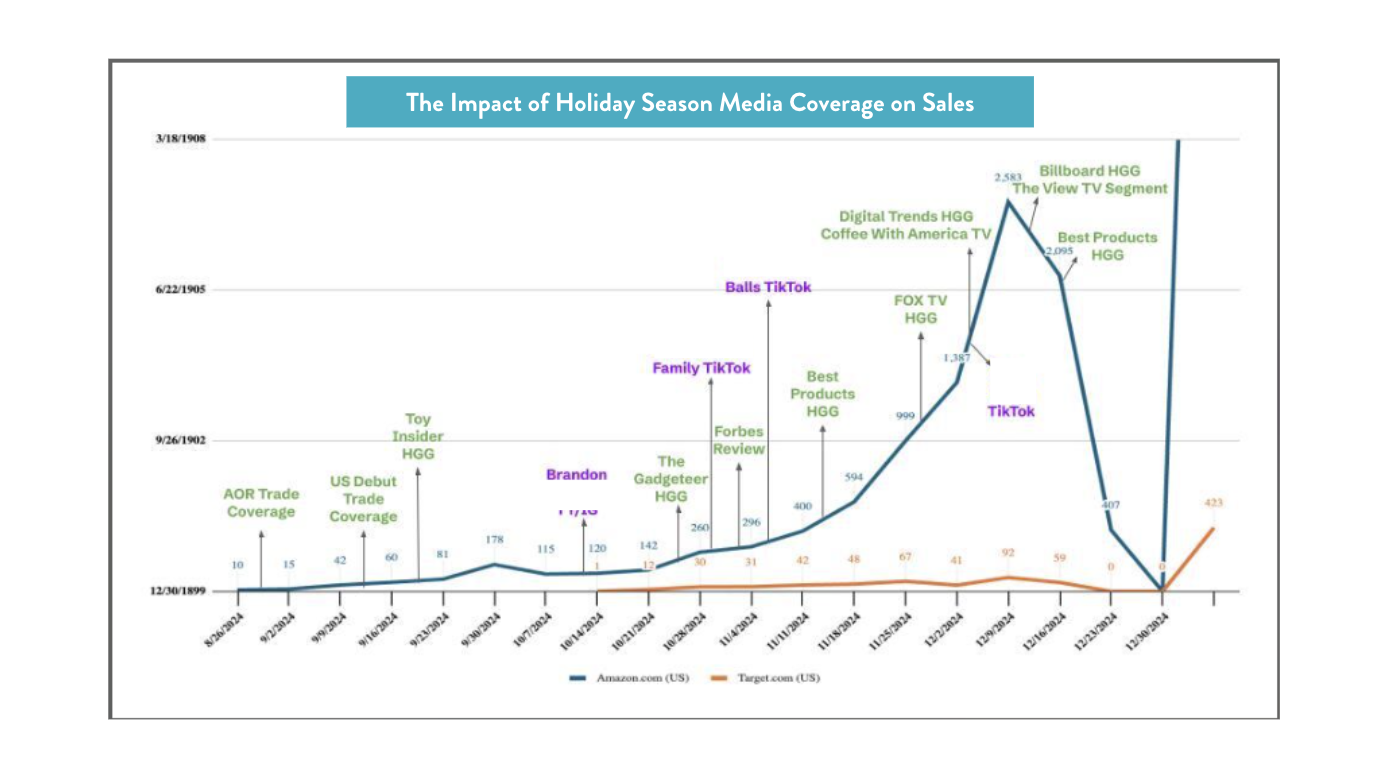
They may not appear instantly on a spreadsheet, but they have the potential to deliver significant impact and drive the business forward. Here’s one example a toy client shared with us after a successful holiday PR campaign.
Effective PR measurement evaluates:
Who is doing the talking (the outlet and the reporter)
What is being said (message inclusion and framing)
How it’s being positioned (tone, prominence, format)
Where it shows up (audience relevance. Also, knowing how earned and owned content impacts LLM visibility has changed the game here.)
This is the gap the CSS was designed to fill. It’s a way to assess the quality and strategic value of coverage instead of just its theoretical exposure.
How to Measure Media Coverage in 2026: Our CSS Criteria
The CSS isn’t static by design. We review it annually to ensure it reflects how influence is earned in the real world. Do we need to adjust the criteria based on new technologies or concepts? Should we replace or redefine a topic? Are there better ways to capture the true value of PR?
Below are the updated 2026 CSS criteria.
Influence: Influence is determined by which of our three tiers a media outlet falls into, based on a combination of factors – relevance to your brand, reach, and credibility. For credibility we take into account a mix of domain authority (DA), LLM visibility, and more. This nods to how credibility is increasingly established in AI-driven discovery but it’s not a magic bullet. DA informs our assessment of credibility and visibility, but it doesn’t override other factors. (Note: We use Moz as our provider because it offers a consistent, marketer-familiar benchmark.)
Bigger doesn’t automatically mean better. An outlet with massive traffic but limited audience relevance may have little business impact, while a niche or trade publication can carry outsized influence with the people who actually make decisions. Our tiering reflects that reality. A Tier 1 outlet for one client may be Tier 2 or Tier 3 for another, depending on who needs to be influenced and how decisions are made in that market.
Content: This criterion is about the percentage of key messaging included in the story, indicating how much the reader learns about the product or service. It assesses if a reader has the opportunity to walk away with a meaningful understanding of the product, service, or point of view. A single, well-articulated message can be more valuable than multiple shallow references.
Strong content signals that the reporter understood the story and chose to explain it. That same strong content becomes an invaluable sales tool.
Image or Video: Including an image or video materially increases visibility, recall, and engagement, signaling stronger editorial investment and amplifying the coverage's overall impact. As they say, a picture is worth a thousand words.
Type: This reflects the level of focus and visibility a brand receives within a piece of coverage. An exclusive feature or byline where your brand or executive stands on its own is always the goal. That said, trend pieces, gift guides, and roundups can also be highly valuable when they deliver meaningful visibility.
To better assess that impact, we refined how we evaluate roundup coverage. We look at where a brand or product appears within the article. Placement matters. Brands featured earlier in a list are more likely to be seen, remembered, and interpreted as editorially significant, similar to the concept of being “above the fold.”
In practice, this means a higher-ranking placement in a longer roundup (e.g., #5 of 50) can be more valuable than a lower-ranking placement in a shorter one (e.g., #15 of 20). The goal is to measure not just inclusion, but real visibility.
Tone: Tone assesses whether coverage is positive, neutral, or negative and the context in which the brand appears. Neutral coverage isn’t inherently bad, and in some cases can be exactly what credibility requires. Negative coverage, however, carries very different implications depending on the outlet’s influence and the story’s framing. Evaluating tone helps identify coverage that introduces reputational risk.
Executive Visibility: Coverage that includes an interview with a client executive signals a higher level of editorial trust and engagement. It allows the company to shape the narrative in its own voice, typically resulting in more nuanced storytelling. Also, getting in front of a reporter – with the right prep – is often the best form of relationship building.
Paywall: We consider whether coverage is freely accessible or gated behind a paywall. While paywalled outlets can carry prestige and influence, open articles are more easily discoverable, shareable, and indexable. This makes them more likely to surface in search results, be referenced in AI-generated responses, and reach audiences beyond existing subscribers. We evaluate this criterion by understanding whether or not the client’s goals value exclusivity or accessibility.
Link/Purchase Link/Call To Action (CTA) Included: While PR is not a direct sales channel, it supports conversion. If a clear CTA or link to Amazon, Walmart, or your own website was included in the coverage, it reduces friction for interested buyers and helps translate attention into next steps.
We assign “points” to each of the above criteria (yes, sometimes we deduct points, too) and the highest possible score is an 11. I’m going to bring it to life using two real-life coverage examples: a feature story in a trade outlet (Diginomica) that scored a 10 and a national TV segment (The Drew Barrymore Show) that scored a 7.5.
Diginomica (Score 10/11):
This was a thought leadership feature in a highly credible trade outlet, written in depth and focused entirely on the client’s POV. The piece allowed for nuance, context, and clear articulation of the executive’s perspective – exactly the kind of coverage that influences how a brand is understood within its industry.
The only factor preventing a perfect score was the absence of a direct link, which limited downstream action. Still, in terms of authority, message control, and relevance to the target audience, this coverage delivered near-maximum strategic value.
The Drew Barrymore Show (Score 7.5/11):

Appearances on national TV shows are understandably appealing to brands. In this case, the segment provided strong visibility for Priority Bicycles and broad consumer exposure.
However, product visibility in TV segments can be brief, with limited opportunity for detailed product messaging, narrative control, or a clear call to action. While highly effective as a top-of-funnel awareness play, the format constrained its ability to drive deeper understanding or immediate consideration resulting in a score below our agency average of 8.5.
If reach is the only PR measurement being tracked, then influence, credibility, and narrative control are left to chance. That may be acceptable for short-term visibility, but it’s a risky way to manage long-term reputation.
The CSS creates a disciplined way to understand why certain coverage has potential to move the business forward while other hits might just look good in a report. Not all coverage is created equal and pretending otherwise makes it harder to invest strategically, learn from outcomes, or build momentum over time.